Every serious angler has tried to make sense of a DNR survey PDF at some point — scrolling through pages of raw numbers trying to figure out if a lake is actually worth the drive. That's an hour you don't get back before you even leave the driveway. Fish Guide Pro pulls that same data out of the PDF and puts it where you can actually use it.
What It Does
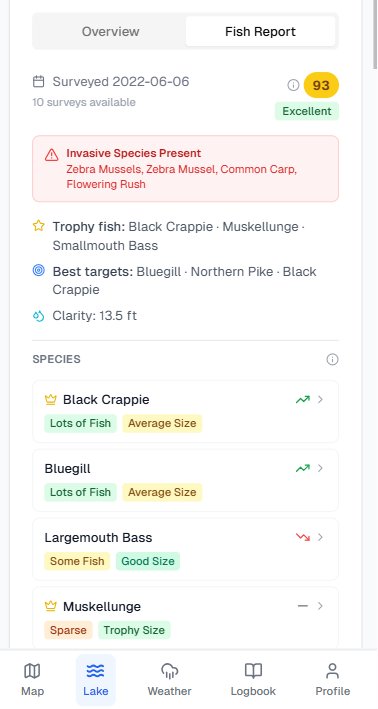
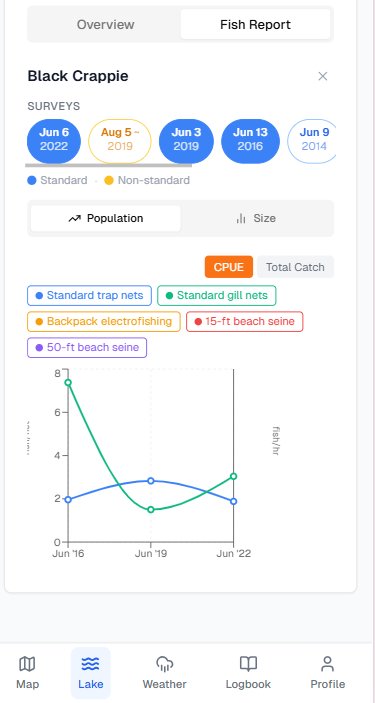
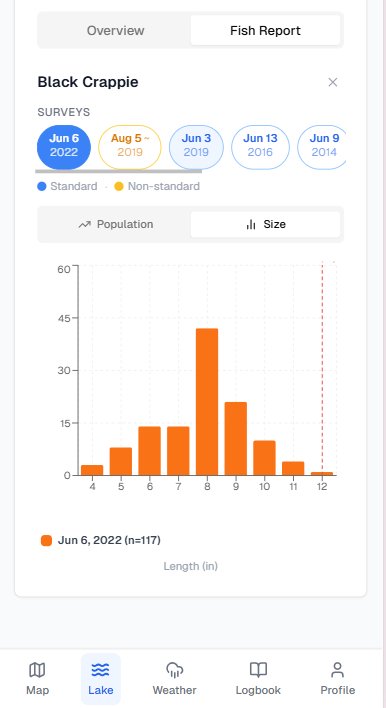
Fish Guide Pro aggregates Minnesota DNR fish survey data so you can evaluate a lake's quality without digging through government reports yourself. For each species, see CPUE (catch per unit effort), a population rating (High to Low), a size rating (Trophy to Small), population trend (Up, Down, Stable), average and max length, average weight, and how the lake ranks in percentile against every other surveyed lake in the state.
Survey data helps you pick the right lake before you commit to the drive — high CPUE paired with an above-average size rating points to a quality fishery, while a declining trend might mean it's time to try somewhere new. Results also flag whether a lake has cisco forage (a strong predictor of big walleye), invasive species presence, and whether a population is self-sustaining or stocked.
Best used for
- ✓ Comparing walleye CPUE and size ratings between a few lakes before a trip
- ✓ Finding lakes in the top percentile for crappie size statewide
- ✓ Identifying lakes with cisco forage that support larger walleye
- ✓ Checking whether a lake's walleye population is trending up or down before you plan a season around it
- ✓ Evaluating a new lake's trophy potential before a long drive