Almost every lake the Minnesota DNR has surveyed has its fish survey posted online, free, for anyone to read. Most anglers have opened a DNR fish survey exactly once: they stared at a table full of numbers, saw the word "CPUE," and closed the tab.
That's a shame, because a DNR lake survey is the closest thing you'll get to looking inside a lake before you fish it. It tells you which fish are in there, roughly how many, and how big they get. You don't need a biology degree to read one. You need to know which three or four numbers to look at, and what to ignore.
Here's how to read a DNR fish survey (some anglers call it a lake survey report or a DNR fish report), one section at a time, using a real Minnesota lake. At each step you'll learn to read the DNR's numbers, and we'll show you how Fish Guide Pro presents the same data in plain English.
Quick answer: For each species you care about, check three things: fish per net (how many), how that compares to the normal range for similar lakes, and the length table (how big). Then read the biologist's written summary. It often explains the numbers.
Jump to:
Where to Find a DNR Lake Survey
DNR fish surveys live in the Minnesota DNR LakeFinder, the DNR's official lookup tool. Search for your lake by name or county, check that the county matches (Minnesota has dozens of Long Lakes, Mud Lakes, and Bass Lakes), and open the fish survey section on the lake's page.
While you're there, note the lake's size and maximum depth. They shape everything else. An 18-foot-deep lake and a 120-foot-deep lake are completely different fisheries.
For the rest of this guide, we'll read one real survey together: Parley Lake in Carver County, near Waconia. It's a 258-acre lake with a maximum depth of 18 feet, managed mainly for bluegill and crappie, and the DNR surveyed it in June 2025.
Step 1: Read the Survey Header (Date, Type, and Gear)
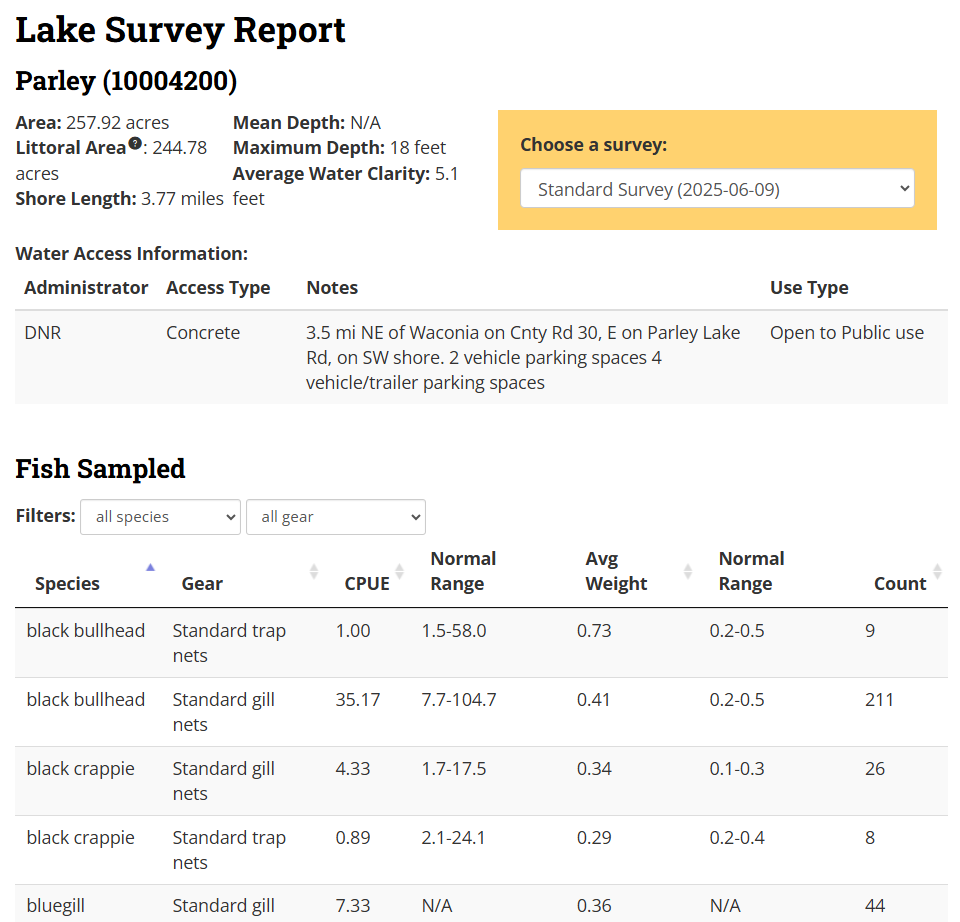
Before you look at a single fish number, check three things. The first two sit in the Choose a survey box at the top of the DNR's Lake Survey Report, which also lets you switch to older surveys.
The date. This matters more than anything else on the page. Fish populations change: winterkill, stocking, a couple of strong year classes, a new special regulation. A survey from 2010 tells you about the lake in 2010. Parley's most recent survey is from June 2025, which is about as current as it gets.
The survey type. Most surveys you'll see are Standard Surveys, the DNR's routine check of the fish community. You may also see Population Assessments or Re-Surveys in a lake's history. For fishing purposes, the most recent standard survey is usually the one to read.
The gear. The biologist's written summary says how many nets were set. Parley's 2025 survey used 9 trap nets and 6 gill nets. That might seem like trivia, but it's the key to reading everything below it.
In Fish Guide Pro: The survey date sits at the top of every lake's Fish Report, so you always know how current the data is. If a lake has several surveys on record, you can switch between them with one tap instead of hunting through the survey list.
Step 2: Know Your Nets (Trap Nets vs. Gill Nets)
The DNR uses different nets because different fish live in different parts of a lake.
| Trap nets | Gill nets | |
|---|---|---|
| Where they're set | Near shore, in shallower water | Out in open water |
| What they catch best | Bluegill, crappie, other panfish | Walleye, northern pike, yellow perch |
| Use them to judge | Panfish numbers | Walleye, pike, and perch numbers |
That's why one species can show up twice in the results table with two very different numbers. On Parley, black crappie came in at 0.9 per trap net and 4.3 per gill net in the same survey. Neither number is wrong; they're measuring with different tools.
Rule of thumb: for each species, focus on the net type designed to catch it. For walleye and pike, read the gill net line. For bluegill, read the trap net line. Crappie get caught in both, so look at both.
In Fish Guide Pro: Catch rates are broken out by gear type and charted on their own lines, so you never mix up a trap net number with a gill net number.
Step 3: Fish Per Net and the Normal Range (How Many)
The most important number in a DNR fish survey is in the Fish Sampled table, in the column labeled CPUE. That's short for catch per unit effort, and for nets it simply means fish per net: the number of fish of that species caught, divided by the number of nets set.
Because standard surveys use the same kinds of nets, fish per net is a fair way to compare a lake to other lakes, and to itself over time. The table also has a Count column, but a raw count like "102 pike" means little until you know how many nets caught them.
The normal range is your benchmark
Right next to CPUE, the survey shows a normal range: the span where the middle half of similar Minnesota lakes fall for that species. This is what turns a number into an answer:
- Above the normal range: more of that fish than most similar lakes.
- Within the normal range: about what you'd expect.
- Below the normal range: fewer than most similar lakes.
Two things trip people up here. The table has two Normal Range columns: the first is for CPUE, and the second is for average weight. And a normal range of N/A means the DNR has no benchmark for that species in that net, usually because it's not the net designed to catch it. On Parley, bluegill in gill nets show N/A; the trap net line is the one to read.
Here's how that played out on Parley in 2025:
- Northern pike: 17.0 per gill net. The DNR called that well above the expected catch rate for similar lakes, and the highest pike catch rate on Parley in 30 years.
- Bluegill: 28.4 per trap net. Near the expected catch rate for similar lakes.
- Black crappie: 0.9 per trap net and 4.3 per gill net. The trap net rate is below its normal range (2.1–24.1); the gill net rate is inside its range (1.7–17.5), toward the low end. The DNR summed it up as near the low end of the expected catch rate.
- Walleye: 1.3 per gill net. Near the expected catch rate.
In Fish Guide Pro: You don't have to compare each catch rate to its normal range in your head. Each species gets a plain-English population rating, like "Lots of Fish," "Some Fish," or "Very Few Fish," plus where the lake ranks against every other surveyed lake in Minnesota.
Fish per net tells you how many fish there are. It tells you nothing about how big they are. For that, you need the next table.
Step 4: Read the Length Table (How Big)
Lower in the survey you'll find a table of fish counts by length: how many of each species were measured at each inch. This is where you find out whether a lake has quality fish or just a lot of small ones.
What to look for:
- Where the counts bunch up. If most fish sit in the small inch groups, the lake has numbers but not size.
- How far the counts stretch. A table that runs into the bigger inch groups means there are quality fish, even if they're few.
- The biggest fish measured. It isn't the lake record, but it's proof of what the lake can grow.
You'll often see the DNR describe a species' size structure as balanced. That means the population sits somewhere between "huge numbers of small fish" and "very few fish, mostly big." For most anglers, balanced is good news.
Parley's crappie show why you need both tables. Trap net catches came in below the normal range, and only 34 black crappie were sampled. But the average length was 7.9 inches, and the largest measured 15.3 inches. Low numbers, but some genuinely big fish. If you'd only read the catch rate, you'd have skipped a lake that grows big crappie.
The same table for Parley's other species:
- Northern pike: 102 sampled, averaging 23.0 inches, with the largest at 35.3 inches. High numbers and good size.
- Bluegill: 256 sampled, averaging 6.0 inches, with the largest at 8.7 inches.
- Walleye: only 8 netted, but averaging 19.8 inches, with the largest at 26.0 inches.
In Fish Guide Pro: The length table becomes a bar chart with a line marking the legal or keeper size, so you can see at a glance how many fish clear it. Each species also gets a size rating, like "Average Size," "Good Size," or "Large Fish."
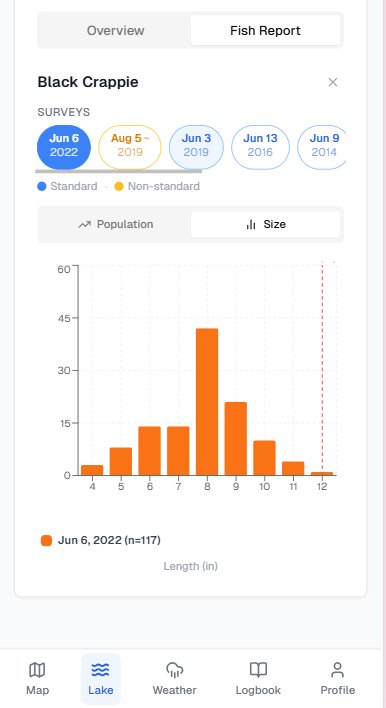
Example from another Minnesota lake's 2022 survey.
Step 5: Don't Skip the Written Summary
Most anglers jump straight to the tables. The biologist's written summary is often the most useful part of a DNR lake survey, because it explains what the numbers can't.
Parley's 2025 summary is a good example. It tells you:
- Why the walleye numbers look the way they do. The lake had a winterkill in 2022–23, the DNR stocked walleye fry in 2023 and 2024, and little of that stocking showed up in the nets. Much of the current walleye population may be fish moving in from Lake Minnetonka through Six Mile Creek. You'd never get that from a table.
- Where fish can and can't go in summer. During the survey, oxygen fell to 2 parts per million at 18 feet, the deepest water in the lake, so fish couldn't use the very bottom in midsummer.
- Special regulations that shape the fishery. Parley is one of seven west-metro lakes in the DNR's Quality Sunfish Initiative, which cut the daily bluegill limit from 20 to 5 in 2021. A separate special regulation that same year cut the black crappie limit from 10 to 5. The DNR reports early signs of bigger bluegill since the change.
- Invasive species. Eurasian watermilfoil is present, a reminder to clean, drain, and dispose before you leave the access.
Always check current regulations before you fish. Special limits change, and a survey is a snapshot, not the regulations booklet.
In Fish Guide Pro: The key flags from the survey are pulled to the top of the Fish Report: invasive species, whether a lake has cisco forage (a strong sign of big walleye), and whether a population reproduces on its own or depends on stocking. Each lake page also lists its current special regulations. For the biologist's full write-up, the DNR summary is still the place to go.
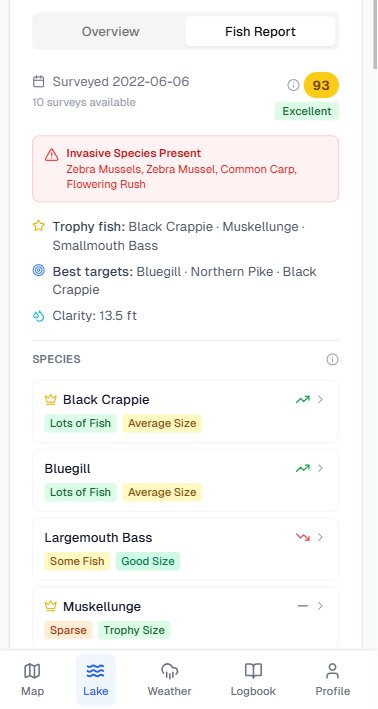
Example from another Minnesota lake's 2022 survey.
Step 6: Compare It to the Lake's Survey History
One survey is a snapshot. Two or three surveys tell you which way a lake is heading. Most lakes have several surveys on record (Parley's go back to 1940), and comparing the last few shows whether a species is trending up, holding steady, or sliding.
Check the lake's stocking report while you're at it. On Parley, the walleye fry stocking after the 2022–23 winterkill explains why walleye are in the lake at all. A species that's stocked regularly may not be reproducing on its own, so its numbers can swing from survey to survey.
On the DNR site, comparing surveys means opening each one and lining up the numbers yourself.
In Fish Guide Pro: Every survey on record is plotted on one trend line per species and gear type, and each species is tagged as trending up, down, or stable.
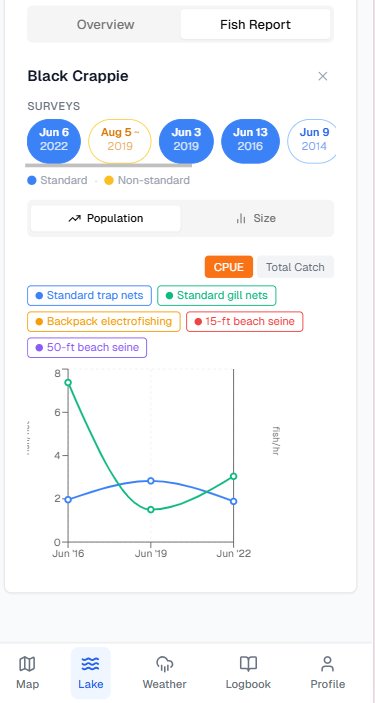
Example from another Minnesota lake with five surveys on record.
Worked Example: Is Parley Lake Worth Fishing?
Put the pieces together and you can size up the whole lake in about a minute:
| Species | How many (fish per net) | How big (length table) | Verdict |
|---|---|---|---|
| Northern pike | 17.0 per gill net, well above normal | 23.0" average, 35.3" largest | Excellent. Lots of fish and good size. |
| Bluegill | 28.4 per trap net, near normal | 6.0" average, 8.7" largest | Good. Steady numbers, and size is improving under the reduced limit. |
| Black crappie | 0.9 per trap net (below normal), 4.3 per gill net (low end of normal) | 7.9" average, 15.3" largest | Few, but some big ones. Worth a trip if you want size, not a full bucket. |
| Walleye | 1.3 per gill net, near normal | 19.8" average, 26.0" largest | Bonus fish. Only 8 netted and the recent stocking hasn't shown up yet, but the ones there are good size. |
That's what a DNR survey is for. In a few minutes, you know Parley is a strong pike lake, a solid bluegill lake, a sleeper for big crappie, and not a lake to plan a walleye trip around.
That took a few minutes with the DNR tables. In Fish Guide Pro it takes one screen. Every surveyed lake gets the same species-by-species breakdown, with ratings, size charts, and trends. Free, no account needed.
Look Up Your Lake FreeUsing a Survey to Pick an Ice Lake
Survey season is summer, but ice season is when the numbers earn their keep. You can't idle around looking at your graph to scout a lake through the ice, so choosing the right lake before you drill counts for more.
- Use the same tables. If a lake's survey shows big crappie or perch in summer, those fish are still there in winter. Parley's big crappie don't disappear at ice-up.
- Read the summary for winterkill. Shallow, fertile lakes are the ones most likely to lose fish under the ice. Parley maxes out at 18 feet and had a winterkill in 2022–23. That's worth knowing before you plan a season around a small lake.
- Pair the survey with a depth map. The survey tells you which lake; the contours tell you where on it. Our guide to where to drill using a depth map picks up from there.
Before you go anywhere, check the ice. Our Minnesota ice thickness chart covers what's safe for walking, ATVs, and vehicles.
Common Mistakes When Reading a DNR Survey
- Comparing trap net numbers to gill net numbers. They measure different things. Compare each species against its own net type and its normal range.
- Trusting an old survey. Check the date first. A lot can change in five or ten years.
- Assuming lots of fish means big fish. High fish per net with a length table full of small fish means a lake full of small fish. Read both tables.
- Writing off a lake because of low numbers. Parley's crappie show how a lake with few fish can still produce big ones.
- Ignoring the rough fish. Black bullhead were among the most abundant fish in Parley's nets. Bullheads handle low oxygen better than most game fish, so lots of them often goes with a lake prone to winterkill, and Parley had one in 2022–23.
- Skipping the written summary. It's where the biologist explains winterkills, stocking, fish moving in from other lakes, and regulation changes.
Read Any Lake's Survey in Seconds
Once you know what the numbers mean, you can read any DNR survey in Minnesota. Fish Guide Pro just gets you there faster. Pull up any surveyed lake and you get the same breakdown we just did by hand: how many fish, how big, which way they're trending, and what to watch out for, with a 1-foot contour map of where that fishery lives. If you're still choosing a lake, the Minnesota lake finder lists every lake in a county that holds your target species.
Fish Guide Pro is an independent app built on public DNR data, and its ratings are our plain-English summary of the DNR's numbers. It is not affiliated with or endorsed by the Minnesota DNR. For full survey reports, stocking records, and water quality detail, the DNR LakeFinder is the official source.
Know your lake. Down to the foot. Browse lakes and DNR surveys free, or start a 7-day Pro trial for 1-foot contours and trophy lake search.
DNR Fish Survey FAQ
What does CPUE mean in a DNR fish survey? CPUE stands for catch per unit effort. In a DNR lake survey it means the number of fish of a species caught per net. It's the standard way to compare how many fish a lake has against similar lakes and against its own past surveys.
What's the difference between a trap net and a gill net? Trap nets are set near shore and are best at sampling panfish like bluegill and crappie. Gill nets are set in open water and are best at sampling walleye, northern pike, and yellow perch. Compare each species using the net type designed to catch it.
Why does my lake show two catch rates for the same fish? Because the fish was caught in both trap nets and gill nets. Each net type has its own catch rate. They aren't contradicting each other; they're measuring with different tools.
What does "normal range" mean on a DNR survey? It's the range where the middle half of similar Minnesota lakes fall for that species. A catch rate above the normal range means more fish than most similar lakes; below it means fewer.
What does "balanced size structure" mean? It means the population sits between two extremes: lots of small fish on one end and very few, mostly large fish on the other. For most anglers, a balanced size structure is a good sign.
How often does the DNR survey a lake? It varies by lake. Many lakes are surveyed every several years, while some larger, heavily fished lakes are sampled more often. Check the survey date, and look at the lake's survey history to see how often it gets checked.
Is the biggest fish in the survey the biggest fish in the lake? No. It's the biggest fish the nets caught during the survey. It's a good sign of what the lake can grow, but bigger fish are almost always out there.
Is there an easier way to read DNR fish surveys? Yes. Apps like Fish Guide Pro summarize DNR survey data for Minnesota lakes into plain-English ratings for fish numbers and size, with charts and trends across surveys. The DNR LakeFinder remains the official source for the full reports.
Parley Lake figures are from the Minnesota DNR's 2025 Standard Survey. Survey results change as the DNR re-samples lakes; check the DNR LakeFinder for the latest.